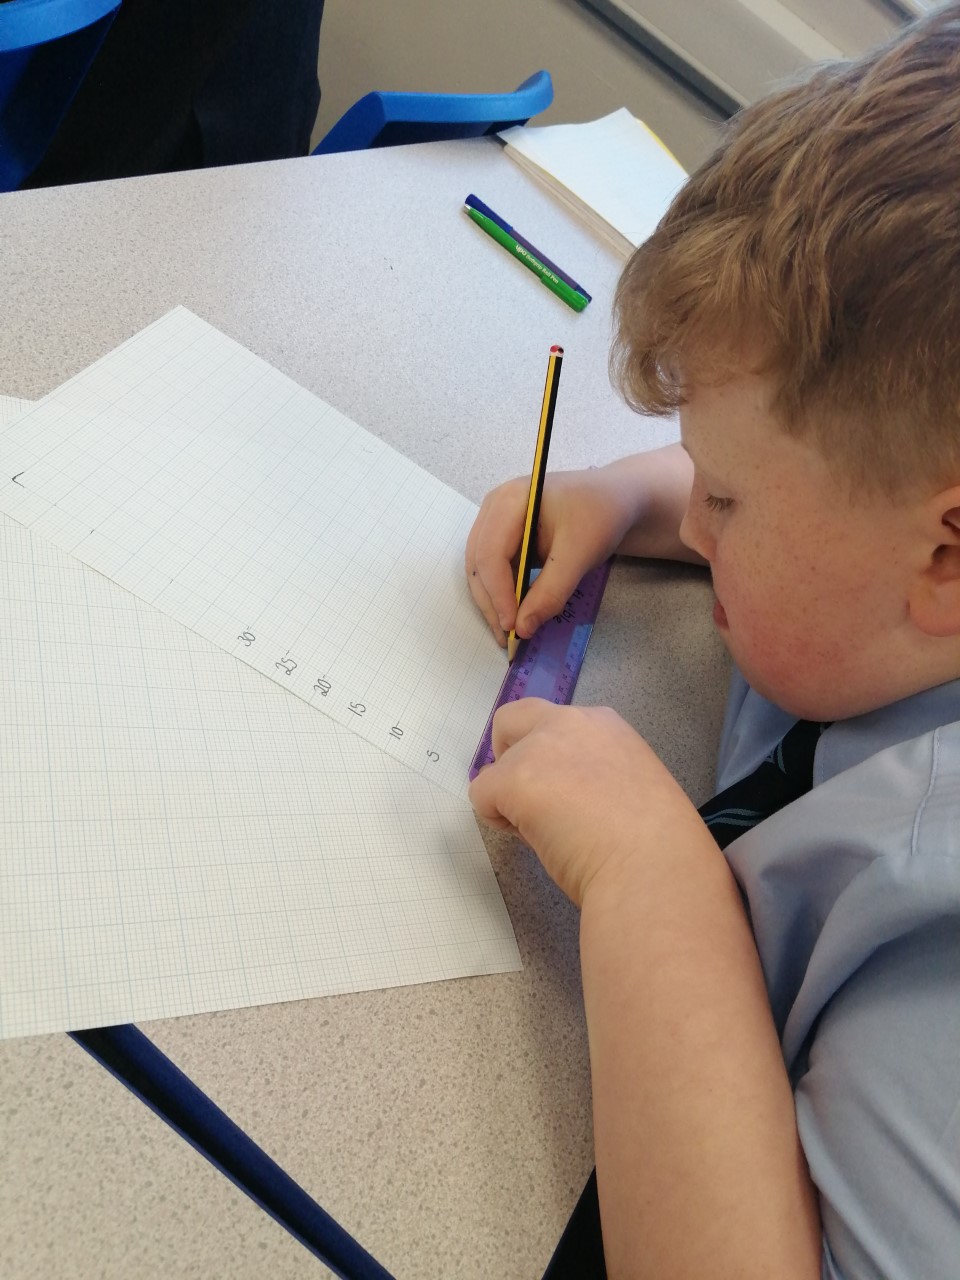
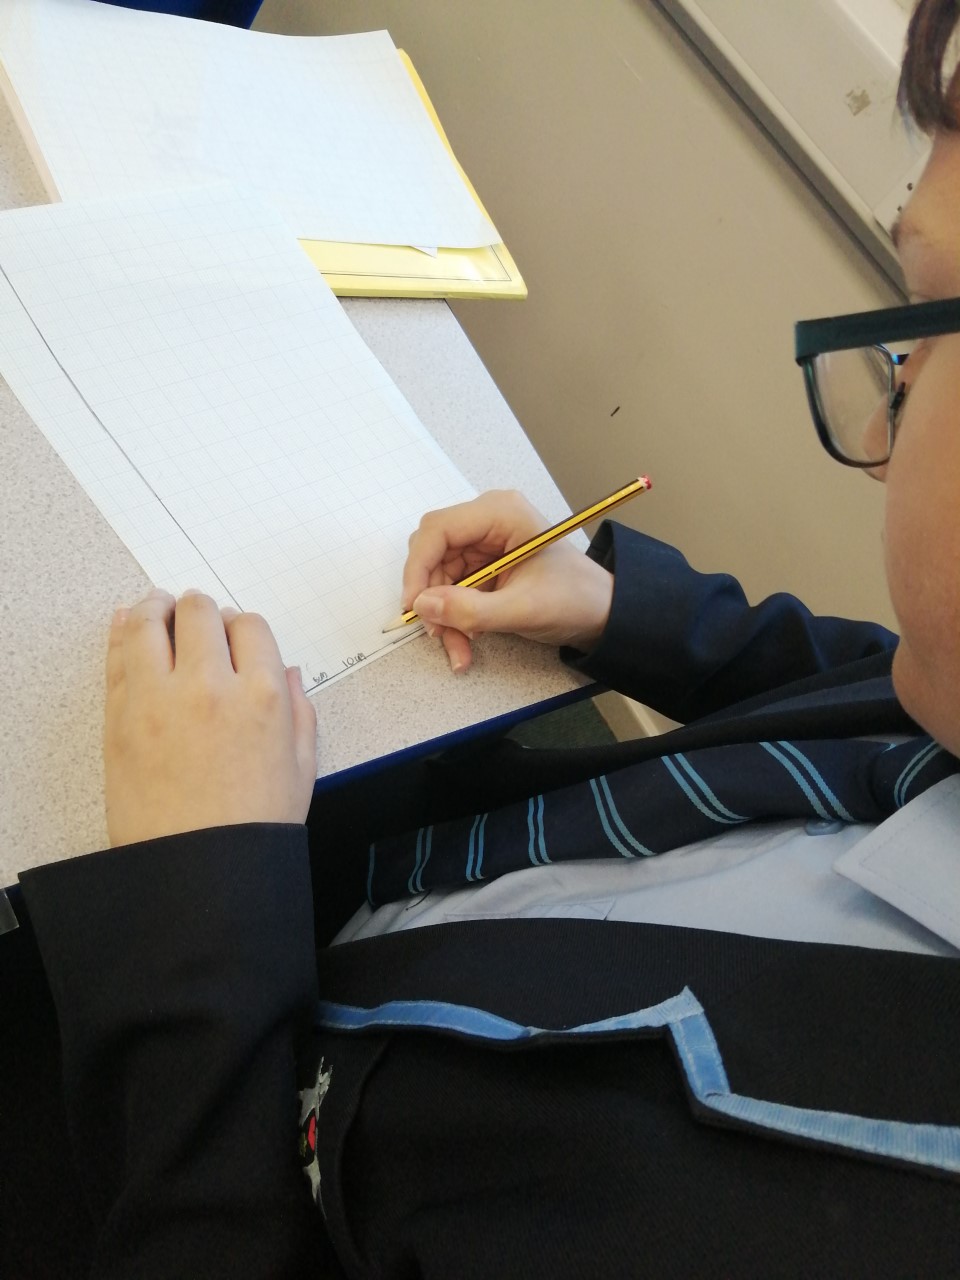
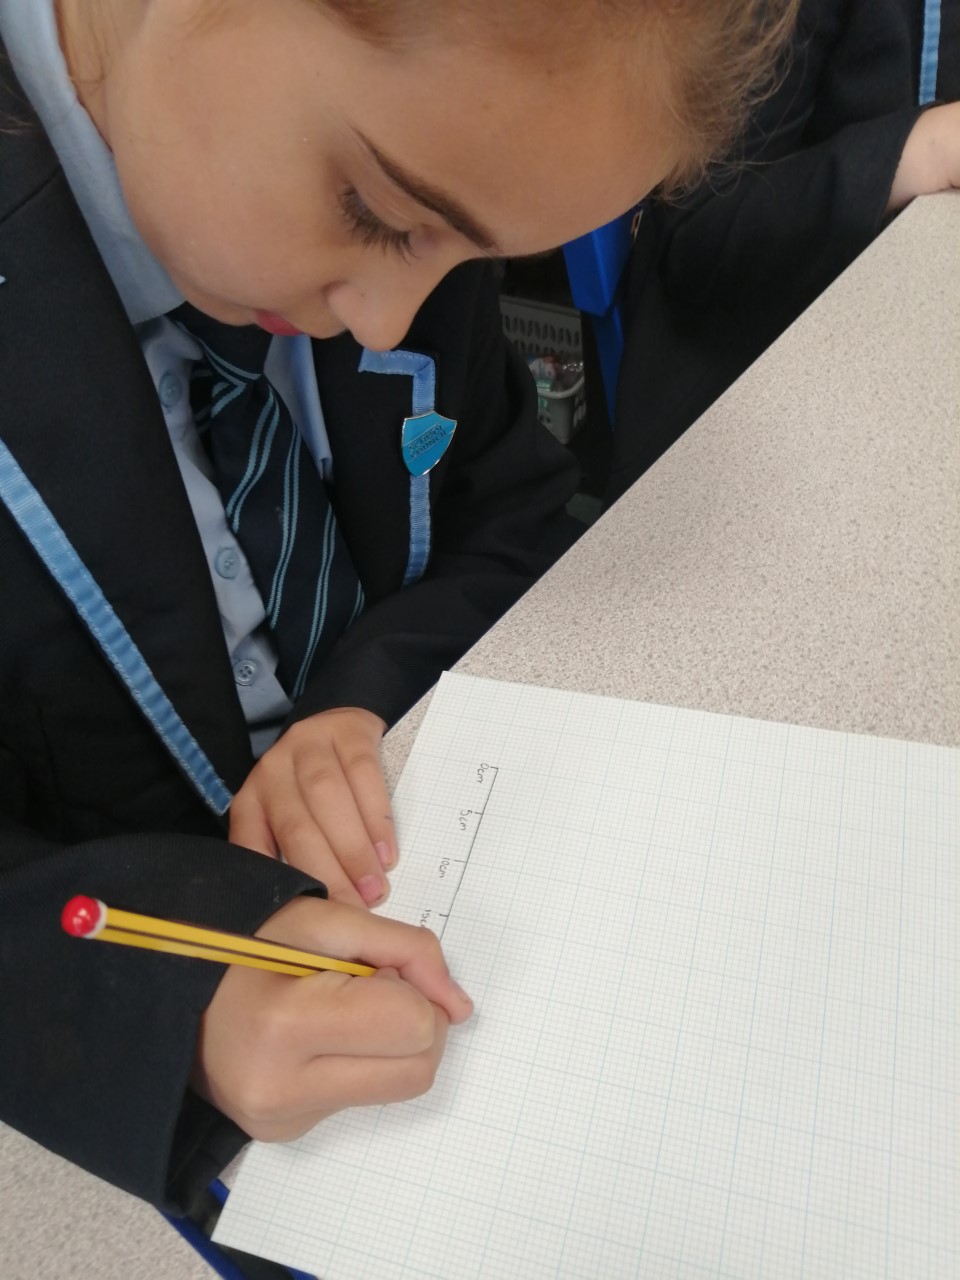
Year Six have been taking results from their shadows investigation and presenting them on a line graph. We learnt how to structure our graph with equal increments and a suitable scale.
Year 6 Science...presenting results

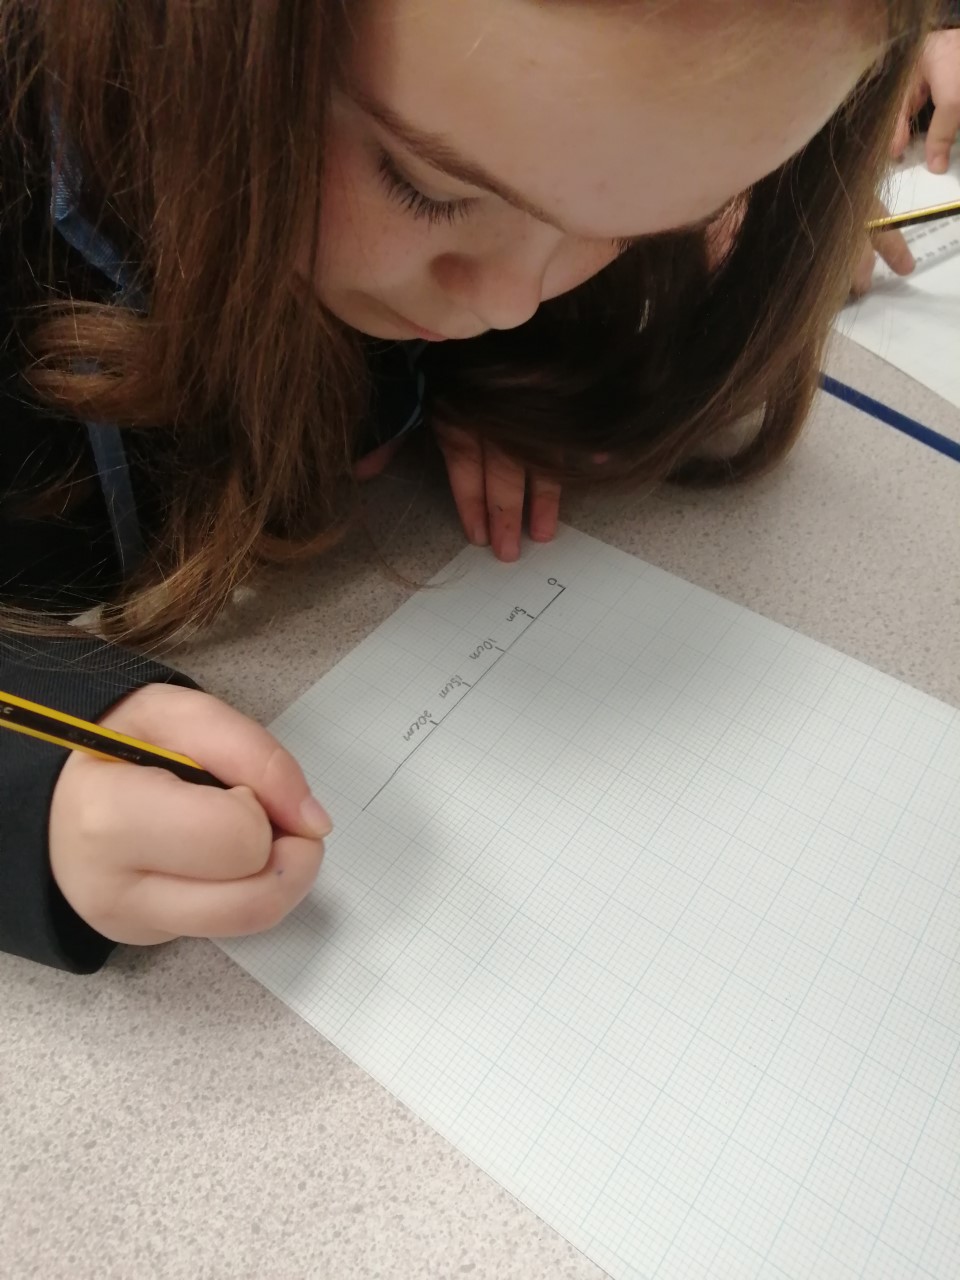
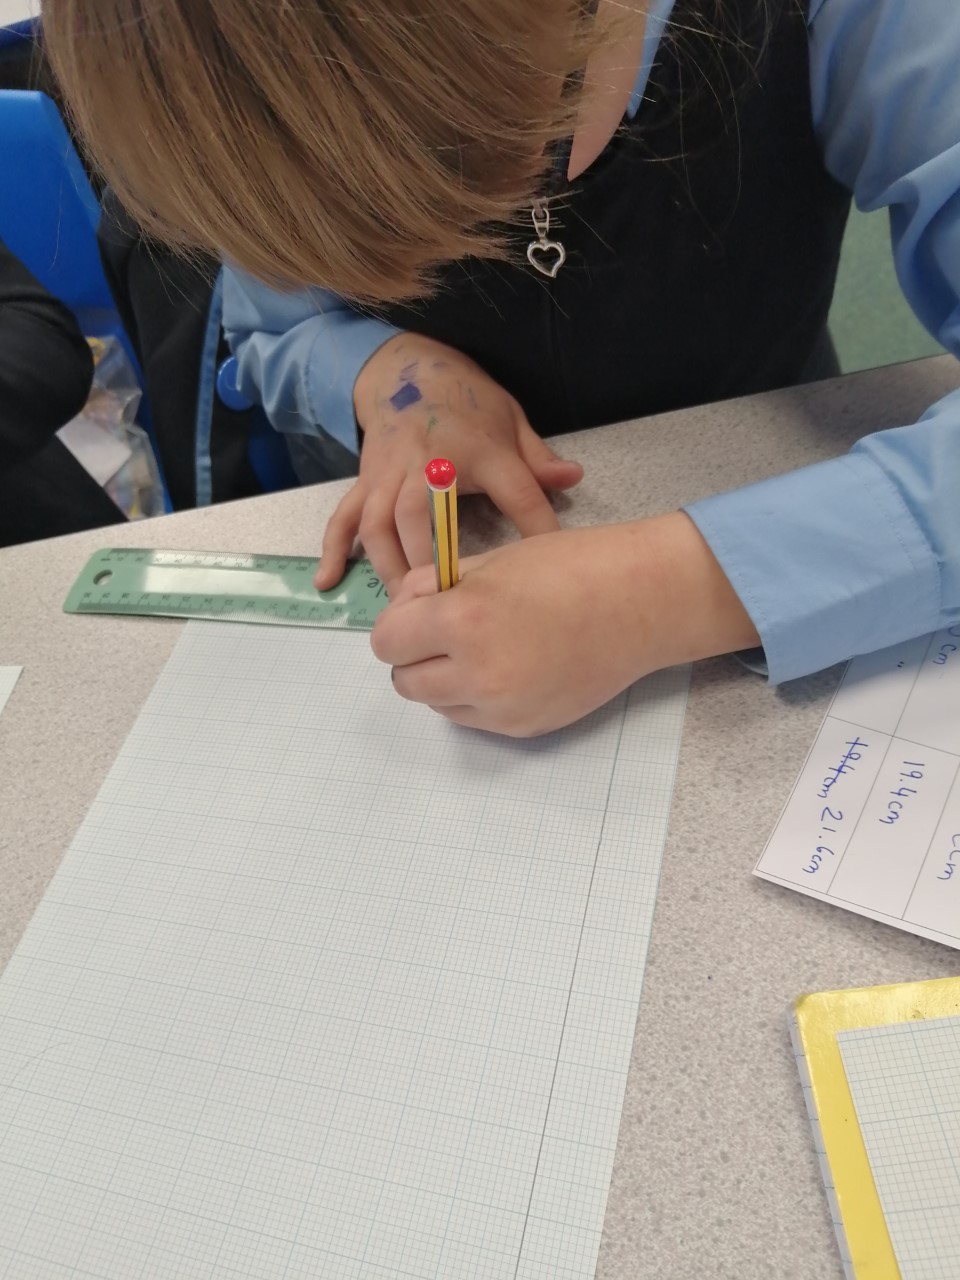
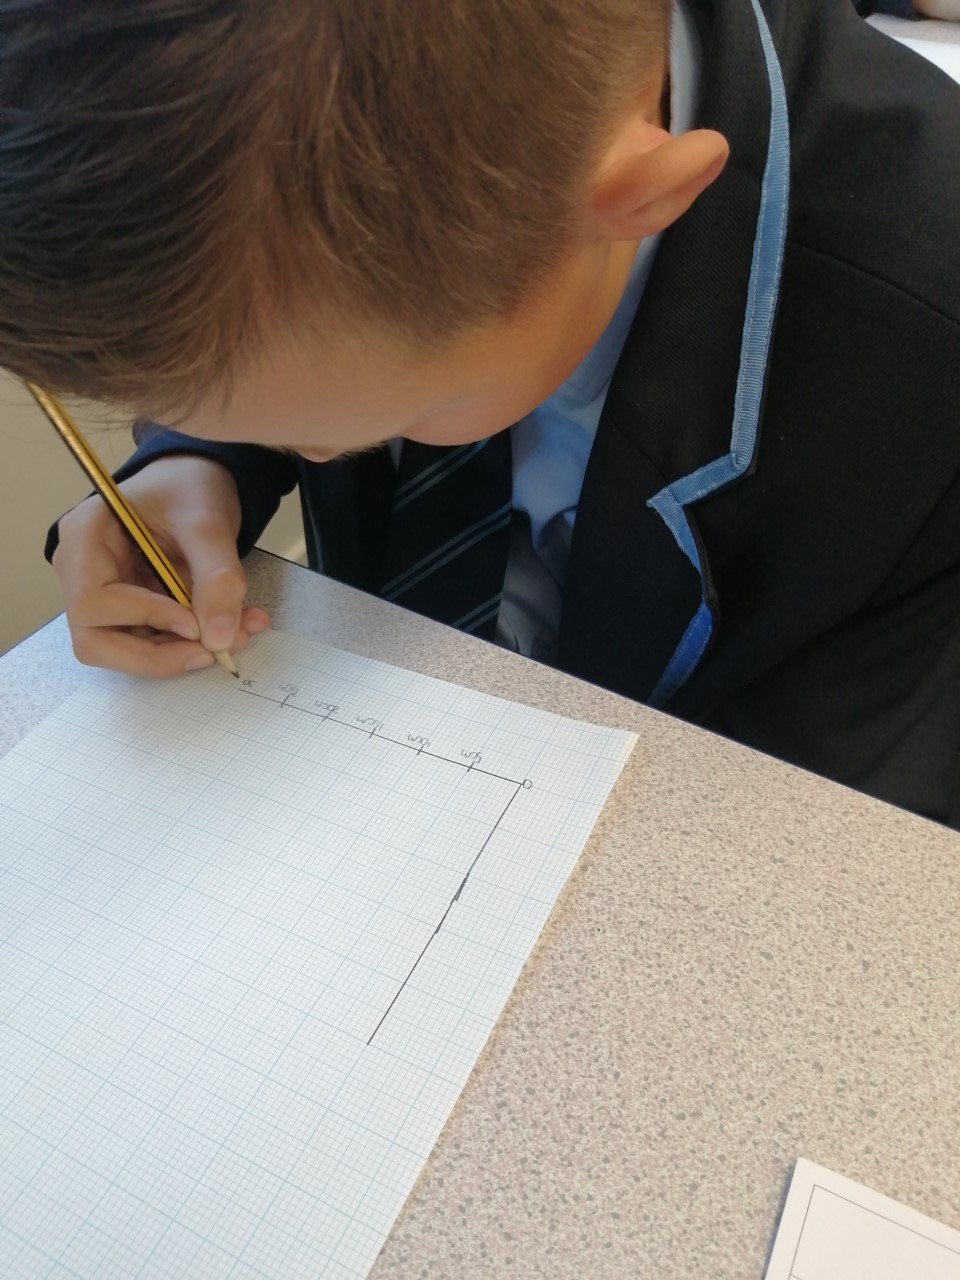
We then reviewed our results and discussed if any variables influenced our findings.